StudentShare

Our website is a unique platform where students can share their papers in a matter of giving an example of the work to be done. If you find papers
matching your topic, you may use them only as an example of work. This is 100% legal. You may not submit downloaded papers as your own, that is cheating. Also you
should remember, that this work was alredy submitted once by a student who originally wrote it.
✕
Free
Distribution of Sales in UK - Speech or Presentation Example
Summary
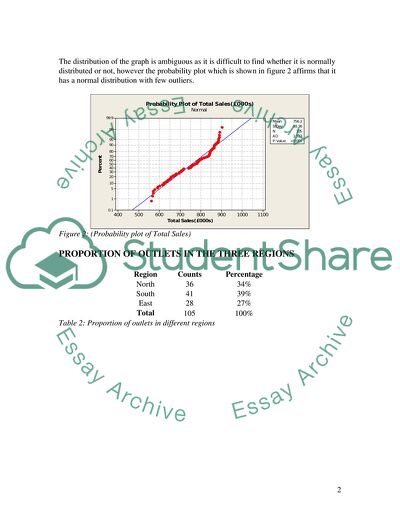
This presentation is about a holistic view of the annual sales made in UK. The distribution of the graph is ambiguous as it is difficult to find whether it is normally distributed or not, however the probability plot which is shown in figure 2 affirms that it has a normal distribution with few outliers…
- Subject: Finance & Accounting
- Type: Speech or Presentation
- Level: Undergraduate
- Pages: 5 (1250 words)
- Downloads: 0
- Author: name51
Extract of sample "Distribution of Sales in UK"
TASK DISTRIBUTION OF SALES IN UK Figure Histogram of Total Sales) The above histogram provides a holistic view of the annual sales made in UK. On average each outlet generates sales of ₤756200. The sample comprises of 105 outlets and the data has been divided as per the standards shown below:
Table 1: Frequency Counts
The distribution of the graph is ambiguous as it is difficult to find whether it is normally distributed or not, however the probability plot which is shown in figure 2 affirms that it has a normal distribution with few outliers.
Figure 2: (Probability plot of Total Sales)
PROPORTION OF OUTLETS IN THE THREE REGIONS
Region
Counts
Percentage
North
36
34%
South
41
39%
East
28
27%
Total
105
100%
Table 2: Proportion of outlets in different regions
Figure 3: (Proportion of outlets in the three regions)
The graph shows that the South Region has the highest number of outlets in its area whereas North region follows the way with 34.3%.
MOST POPULAR SCREEN IN THE THREE REGIONS
Figure 4: (Popularity of screens in different region)
Region
TYPE A (£000s)
TYPE B (£000s)
TYPE C (£000s)
North
6517
9125
11816
South
7084
10367
13538
East
4888
6887
9181
Table 3: Data on screens and region
From the above table and diagram we conclude that TYPE C screen is the most popular across all the regions with a share of approximately 43%.
COMPARISON OF MALE & FEMALES SALES WITH TYPE OF SCREEN
Gender
TYPE A (£000s)
TYPE B (£000s)
TYPE C (£000s)
Male
7866
10778
14604
Female
10623
15601
19931
Table 4: Data on sales for different type of screens across both gender without sample size
Simply making judgments based on the above table can lead to false conclusion since it does not show the number of male and female managers. However, after incorporating the data for size of both genders we can find the average sales made by each manager.
Male = 44
Female = 61
Gender
Average Sales TYPE A (£000s)
Average Sales TYPE B (£000s)
Average Sales TYPE C (£000s)
Male
179
245
332
Female
174
256
327
Table 4: (Data on sales for different type of screens across both gender with sample size)
Figure 5: (Average sales for different type of screens by male and female managers)
From the above figures we can conclude that TYPE A & TYPE C screen are sold the most by male managers as compared to female managers.
ANNUAL SALES AND TYPE OF GENDER
Null Hypothesis:
(There is no difference in the annual sales made by both the genders)
Alternative Hypothesis:
(There is a difference in the annual sales made by both the genders)
Two-Sample T-Test and CI: Total Annual Sales, Gender
Gender
N
Mean
StDev
SE Mean
Male
44
755.6
98.2
15
Female
61
756.6
90.4
12
Difference = mu (1) - mu (2)
Estimate for difference: -1.0
95% CI for difference: (-38.3, 36.3)
T-Test of difference = 0 (vs not =): T-Value = -0.05 P-Value = 0.958 DF = 88
If the value of the test statistic is less than -2.262 or greater than 2.262 than reject; otherwise do not reject.
Figure 6: (Distribution Plot)
Since the value of t-test statistic is -0.05 as found in the Minitab output given above therefore we reject do not reject the null hypothesis and we can conclude that there is no difference in the annual sales made by male compared to female managers.
The two similar diagrams below confirm that there is no variation in the annual sales made by male compared to female managers.
Figure 7: (Individual Plots)
RELATIONSHIP OF TOTAL SALES WITH ADVERTISING
Figure 8: (Regression line for annual sales and advertising budget)
Pearson correlation of Advertising (£) and Total Sales(£000s) = 0.784
The correlation test from the Minitab output shows that there is a strong relationship between total sales and advertising budget recommended for outlet because the correlation value 0.784 is close to 1.
Regression Analysis: Total Sales (£000s) versus Advertising (£)
The regression equation is
Total Sales (£000s) = 510.4 + 0.2400 Advertising (£)
S = 58.2296 R-Sq = 61.4% R-Sq (adj) = 61.0%
Analysis of Variance
Source DF SS MS F P
Regression 1 555267 555267 163.76 0.000
Error 103 349241 3391
Total 104 904508
RELATIONSHIP OF TOTAL SALES AND DISTANCE OF OUTLETS
Figure 9: (Regression line for annual sales and distance of outlets)
Pearson correlation of Total Sales (£000s) and Distance (miles) = -0.777
There is a strong negative correlation between distance of outlets from the high street and annual sales which implies that if the distance of outlet from the high street is increased than the sales will fall heavily due to the influencing variable.
Regression Analysis: Total Sales (£000s) versus Distance (miles)
The regression equation is
Total Sales (£000s) = 933.7 - 80.17 Distance (miles)
S = 59.0155 R-Sq = 60.3% R-Sq (adj) = 60.0%
Analysis of Variance
Source DF SS MS F P
Regression 1 545776 545776 156.70 0.000
Error 103 358732 3483
Total 104 904508
TASK 2
SOCIAL TRENDS
Household expenditure: by purpose
United Kingdom
1971
1981
1991
2001
2007
Food and non-alcoholic drinks
21
17
12
9
9
Alcoholic drinks and tobacco
7
6
5
4
4
Clothing and footwear
9
7
6
6
6
Housing, water and fuel
15
17
18
18
20
Household goods and services
7
7
6
6
6
Health
1
1
2
2
2
Transport
12
15
15
15
14
Communication
1
2
2
2
2
Recreation and culture
9
9
10
12
12
Education
1
1
1
2
2
Restaurants and hotels
10
11
12
11
12
Miscellaneous goods and services
7
7
11
11
11
Total domestic household expenditure
100
100
100
98
98
of which goods
65
61
53
49
47
of which services
35
40
47
49
51
Source: Office for National Statistics
Table 5: (Data for household expenditure)
Figure 10: Changes in household expenditure over the period of time
From 1971 to 2007, we have seen drastic changes in the proportion of different expenditure categories. The proportion of total household expenditure on services in the UK increased from 35% to 51%. Food and non-alcoholic drink was the largest category in 1971, which accounted for almost for 21% of expenditure, but this category has tumbled down to 9 %. However this does not imply that the real expenditure on food and alcoholic drink is falling rather the percentage on goods and services is increasing more rapidly than other categories.
We will now examine one of the variables to predict what will happen in the future.
FORECAST OF FOOD AND NON-ALCOHOLIC DRINKS
Figure 11: (Fitted line plot for number of years and Food and non-alcoholic drinks)
Pearson correlation of Year and Food and non-alcoholic drinks = -0.979
Regression Analysis: Food and non-alcoholic drinks versus Year
The regression equation is = 20.74 - 0.3537 Year
We will now forecast what will be the percentage of Food and non-alcoholic drinks in 2020. Since we assumed that 1971 has a value of 1 therefore the value of 2020 would be 50. Inputting the value to the equation provides:
Food and non-alcoholic drinks (2020) = 20.74 - 0.3537(50) = 3.06 %
Read
More
sponsored ads
Save Your Time for More Important Things
Let us write or edit the speech or presentation on your topic
"Distribution of Sales in UK"
with a personal 20% discount.
GRAB THE BEST PAPER
