StudentShare

Our website is a unique platform where students can share their papers in a matter of giving an example of the work to be done. If you find papers
matching your topic, you may use them only as an example of work. This is 100% legal. You may not submit downloaded papers as your own, that is cheating. Also you
should remember, that this work was alredy submitted once by a student who originally wrote it.
✕
Free
Burberry Company - Financial Analysis - Case Study Example
Summary
Founded in 1856, Burberry Group plc is engaged in designing, sourcing, manufacturing and distributing luxury clothing, fashion accessories, watches and jewelry, shoes, bags, eyewear, perfumes for men, women and children using its own well-known “Burberry” brand. The company…
- Subject: Finance & Accounting
- Type: Case Study
- Level: Undergraduate
- Pages: 4 (1000 words)
- Downloads: 0
- Author: maegan01
Extract of sample "Burberry Company - Financial Analysis"
BURBERRY COMPANY: A FINANCIAL ANALYSIS Founded in 1856, Burberry Group plc is engaged in designing, sourcing, manufacturing and distributing luxury clothing, fashion accessories, watches and jewelry, shoes, bags, eyewear, perfumes for men, women and children using its own well-known “Burberry” brand. The company also licenses qualified third parties to manufacture and sell as wholesalers or retailers its array of products. Through the years, Burberry stores have flourished across Europe, North America, Asia and the Middle East. As of March 2012, Burberry has 192 mainline stores, 208 concessions, 44 outlets and online shops and 57 franchise stores.1
Undaunted by the economic challenges that abound in the United States and the European markets where the recovery from the 2008 financial crisis has not been as easy or as fast as many might have hoped, Burberry has set its sights on ‘longer-term prospects for luxury’s continued growth’ and has not shied away from investing in the coming fiscal year 2012/13 on market review and research that will be centered on important sites in Asia.2
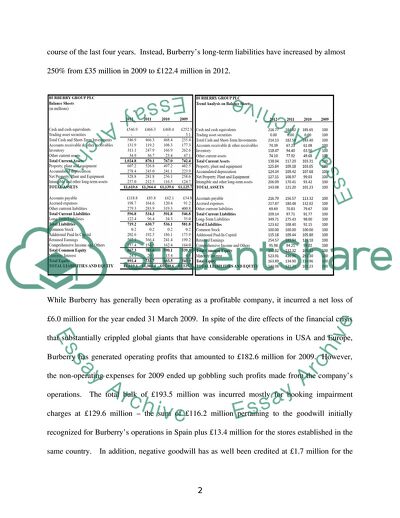
Indeed, Burberry has turnout to be resilient. Since 2009, the company’s assets have grown by 43% and its equity has increased by 64%. The equity growth is mostly due its Retained Earnings that have more than doubled during the last four fiscal years of the company – from £199.2 million in 2009 to £507.1 in 2012. To fuel the continuing expansion of its operations in the last four years and to fund its working capital requirements, Burberry has not opted to issue additional common shares. Thus, its common stocks, at par value, have not increased in the course of the last four years. Instead, Burberry’s long-term liabilities have increased by almost 250% from £35 million in 2009 to £122.4 million in 2012.
While Burberry has generally been operating as a profitable company, it incurred a net loss of £6.0 million for the year ended 31 March 2009. In spite of the dire effects of the financial crisis that substantially crippled global giants that have considerable operations in USA and Europe, Burberry has generated operating profits that amounted to £182.6 million for 2009. However, the non-operating expenses for 2009 ended up gobbling such profits made from the company’s operations. The total bulk of £193.5 million was incurred mostly for booking impairment charges at £129.6 million – the sum of £116.2 million pertaining to the goodwill initially recognized for Burberry’s operations in Spain plus £13.4 million for the stores established in the same country. In addition, negative goodwill has as well been credited at £1.7 million for the formation of the Burberry Middle East joint venture. These procedures were conducted in compliance with International Financial Reporting Standards (IFRS) regulations that uphold International Accounting Standards (IAS) #36, which require the writing down of impaired assets and the recognition of impairment losses on goodwill and intangible assets.3
The foregoing matter aside, Burberry’s operations has delivered Earnings Before Income Tax (EBIT) that increased year-on-year from 2009 to 2013. In fact, the company’s EBIT in 2012 is 195% of the equivalent in 2009. The income statements below provide that while Burberry’s revenues increased by 54.57% from 2009 to 2012, its cost of sales increased by only 4.22%. This reflects an increased efficiency in the operations – sourcing, production and distribution.
The balance sheets and income statements of Burberry for the years 2009 to 2012 reflect an overall uptrend of its income and, subsequently, its book value per share.
The common-size balance sheets highlights the increasing share of Burberry’s equity vis-à-vis the decreasing share of its total liabilities in the total assets of the company. It means that the investment of creditors in the form of loans, etc. have through time become less than the worth of the company’s equity. While the company’s assets were represented as 51.68%-liabilities and 48.32%-equity in 2009, this trend has reversed by 2012 when the company’s equity has amounted to a higher percentage of the company’s assets.
Meanwhile, the common-size income statement highlights the increased net income margin delivered by the company. From incurring a net loss in 2009 and ending up with a 6.87%-net margin, Burberry has gone on to increase it to 14.18% by 2012. This reflects efficient management of operations.
The following ratios compare the financial performance of Burberry and Next plc for the same operating years (from 2009 to 2012):
Founded in 1864, Next PLC (or Next) is similarly engaged in retailing clothes, footwear and accessories for men, women and children as well as gift items and homeware products. (Bloomberg Businessweek 2013)
Comparing the Net Profit Margins of Burberry and Next reveals that while Burberry incurred a net loss in 2009 and while Next has been consistently profitable during the four-year period, it is Burberry that has delivered the higher Net Profit Margins, especially in the last two years. However, Next has been far better in delivering better returns in terms of ROA and ROE. The ROAs and ROEs of the two companies declare that Next has generated much higher returns for every dollar worth of its assets and equity, compared to Burberry. The disparity of the ROAs and ROEs of the two companies logically dictate that the same level of disparity would exist between their financial leverage or gearing ratios. True enough, Burberry’s leverage ratios reflect that its long-term debts are much smaller than its equity – it owes only a range of £0.06 to £0.14 for every £1.00 that it has as equity. In contrast, Next owes £2.03 to £4.06 for every £1.00 of its equity for the last four years.
Burberry also turns out to be the company with higher liquidity levels. Even so, both Burberry and Next have healthy liquidity levels. Both have sufficient current assets to pay off their current liabilities.
The Asset Turnover (ATO) ratios of the two companies point to Next as the one with the higher efficiency in utilizing assets for its selling activities. The same is true with their Inventory Turnover (ITO). Next’s inventory are used in more production and selling cycles as compared to Burberry’s. The latter, though, has the higher Receivables Turnover (RTO). Burberry turns out to be better in converting its accounts receivables into cash – it must be the better company in identifying the clients to give credit lines to and in ensuring that the same clients pay their dues on time.
Both Burberry and Next have done well in the last four years. Both are also equipped with sufficient cash resources to ensure the payment of their liabilities and the continued profitability of their operations. The Annual Reports of both companies express confidence and the resolve to move forward with their growing operations. This should not come as surprising in the light of the relative success of both companies in hurdling the years that immediately followed the 2008 financial crisis.
Bibliography
BLOOMBERG BUSINESSWEEK, ‘Burberry Group Plc (BRBY:London)’, (2013),
, accessed 29 March 2013
BLOOMBERG BUSINESSWEEK, ‘Next PLC (NEXT:London)’, (2013),
[accessed 29 March 2013]
BREALEY, R.A., MYERS, STEWART C. and ALLEN, FRANKLIN, Principles of Corporate Finance 9th Edition (New York, NY: The McGraw-Hill Companies, Inc., 2008).
BURBERRY PLC, ‘Burberry Annual Report 2011/2012’, (2012), , accessed 28 March 2013.
BURBERRY PLC, ‘Burberry Group plc Preliminary Results for the year ended 31 March 2010’, (2010), < http://www.burberryplc.com/file.axd?pointerid=f0fe97e565da41b39795c9c ec1511fd2>, accessed 30 March 2013.
PENMAN, S., Financial Statement Analysis and Security Valuation 5th Edition (New York, NY: The McGraw-Hill Companies, Inc., 2013).
SGV & CO ERNST & YONG, ‘Impairment of long-lived assets, goodwill and intangible assets’, (2013), , accessed 30 March 2013.
THOMSON FINANCIAL, ‘Next PLC Worldscope Company Profile Report’, (2013), [accessed 29 March 2013]
Read
More
sponsored ads
Save Your Time for More Important Things
Let us write or edit the case study on your topic
"Burberry Company - Financial Analysis"
with a personal 20% discount.
GRAB THE BEST PAPER
