StudentShare

Our website is a unique platform where students can share their papers in a matter of giving an example of the work to be done. If you find papers
matching your topic, you may use them only as an example of work. This is 100% legal. You may not submit downloaded papers as your own, that is cheating. Also you
should remember, that this work was alredy submitted once by a student who originally wrote it.
✕
Free
Financial Ratio Analysis of of Nestle and Lindt - Assignment Example
Summary
The more liquid current assets such as cash of Nestle are exhausted faster than the current assets of Lindt because it has a smaller quick…
- Subject: Finance & Accounting
- Type: Assignment
- Level: College
- Pages: 4 (1000 words)
- Downloads: 0
- Author: pstracke
Extract of sample "Financial Ratio Analysis of of Nestle and Lindt"
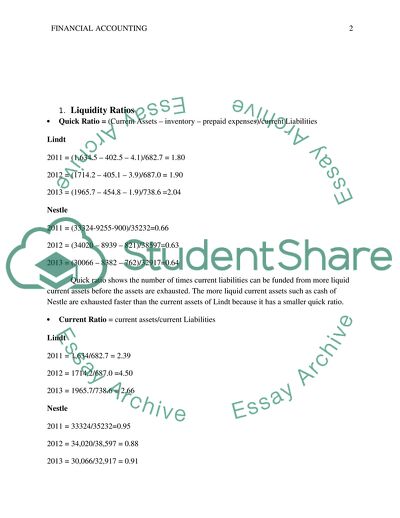
Financial Ratio Analysis Liquidity Ratios Quick Ratio = (Current Assets – inventory – prepaid expenses)/currentLiabilities
Lindt
2011 = (1,634.5 – 402.5 – 4.1)/682.7 = 1.80
2012 = (1714.2 – 405.1 – 3.9)/687.0 = 1.90
2013 = (1965.7 – 454.8 – 1.9)/738.6 =2.04
Nestle
2011 = (33324-9255-900)/35232=0.66
2012 = (34020 – 8939 – 821)/38597=0.63
2013 = (30066 – 8382 – 762)/32917=0.64
Quick ratio shows the number of times current liabilities can be funded from more liquid current assets before the assets are exhausted. The more liquid current assets such as cash of Nestle are exhausted faster than the current assets of Lindt because it has a smaller quick ratio.
Current Ratio = current assets/current Liabilities
Lindt
2011 = 1,634/682.7 = 2.39
2012 = 1714.2/687.0 =4.50
2013 = 1965.7/738.6 = 2.66
Nestle
2011 = 33324/35232=0.95
2012 = 34,020/38,597 = 0.88
2013 = 30,066/32,917 = 0.91
Current ratio shows the number of times current liabilities can be funded from current assets before the assets are exhausted. Lindt pays its current liabilities more times than Nestle does before the current assets are exhausted because it has a higher current ratio.
Times Interest Earned Ratio = EBIT/interest expense
Lindt
2011 = 328.7/10.2 = 32.23
2012 = 330.1/5.4 = 61.13
2013 = 404.1/3.9 = 103.6
Nestle
2011 = 12,471/536 = 23.27
2012 = 13,388/825 = 16.23
2013 = 13,068/850 = 15.37
2. Solvency Ratios
Debt to Equity Ratio = Total liabilities/total equity
Lindt
2011 = 934.1/1,587.2 = 0.59
2012 = 946.5/1,694.4 = 0.56
2013 = 1,246.0/2,634.7 = 0.47
Nestle
2011 = 55817/58274 =0.96
2012 = 63,213/62,664 = 1.01
2013 = 56,303/64,129 = 0.88
Debt to equity ratio shows the ability of the total equity to write off total liabilities. This therefore, gives the number of times that the total equity can pay total liabilities. This means that Nestle has more debts than equity while Lindt has more equity than its debts because it has lower ratios.
Equity Ratio = total equity/total assets
Lindt
2011 = 1,587.2/2,521.3 = 0.63
2012 = 1,694.4/2,640.9 = 0.64
2013 = 2,634.7/3,880.7 = 0.68
Nestle
2011 = 58274/114091 = 0.51
2012 = 62,664/125,877 = 0.50
2013 = 64,129/120,442 = 0.53
This ratio shows the amount of total assets funded by equity. A higher ratio shows that more equity is used to fund assets. Therefore, the figures show that Lindt uses more of its equity to fund assets.
Debt Ratio = Total liabilities/total assets
Lindt
2011 = 934.1/2,521.3 = 0.37
2012 = 946.5/2,640.9 =0.36
2013 = 1,246.0/3,880.7 =0.32
Nestle
2011 = 55817/114091 = 0.49
2012 = 63,213/126,877 =0.50
2013 = 56,303/120,442 = 0.47
This gives the amount of total assets that are financed by debts (Harrison and Horngren 2001). Nestle has a higher debt ratio which means that it uses more debts to fund total assets than Lindt
3. Profitability ratios
Operating profit Margin Ratio = Operating profit/net sales
Lindt
2011 = 328.7/2,488.6 = 0.13
2012 = 330.1/2,669.5 = 0.12
2013 = 401.1/2,882.5 = 0.14
Nestle
2011 = 12471/83642 = 0.15
2012 = 13,388/89,721 = 0.15
2013 = 13,068/92,158 =0.14
The ratio indicates the ability of the company to control its operating expenses. Both Nestle and Lindt have the same operating profit margin which means that they both have equal ability to control operating expenses.
Net Profit Margin = net income/net sales
Lindt
2011 = 246.5/2,488.6 = 0.10
2012 = 244.9/2,669.5 = 0.09
2013 = 303.0/2,882.5 = 0.11
Nestle
2011 = 9804/83642 = 0.12
2012 = 10,677/89,721 = 0.12
2013 = 10,445/92,158 = 0.11
Net profit margin indicates the ability of the firm to control it financing expenses (Harrison and Horngren 2001). Both Nestle and Lindt have the same net profit margin which means that they both have equal ability to control financing expenses.
Return on Equity Ratio = net income/shareholders equity
Lindt
2011 = 246.5/1,619.1=0.15
2012 = 244.9/1694.4=0.14
2013 = 303.0/2,634.7=0.12
Nestle
2011 = 9804/58274 = 0.17
2012 = 10,677/62,664=0.17
2013 = 10,446/64,139=0.16
Return on equity ratio indicates the amount of profits earned for each value of equity contributed by shareholders (Harrison and Horngren 2001). The above figures show that Nestle earns more profits for each value of equity contributed.
Return on Assets Ratio = net income/average total assets
Lindt
2011 = 246.5/2,516.0 = 0.10
2012 = 271.9/2,619.9 = 0.10
2013 = 303.0/3,880.7 = 0.08
Nestle
2011 = 9,804/114,091 = 0.09
2012 = 10,677/125,877 = 0.08
2013 = 10,445/120,442 = 0.09
Return on assets refers to the proportion of profits received from a unit of assets invested. Nestle recorded return on assets ratio of 0.09 in 2013 meaning that for every unit of asset invested, a profit of 0.09 is earned. Lindt has almost the same return on assets ratio as Nestle, meaning that the two companies equally utilize their assets to earn profits.
Return on capital employed = net operating profit/ (total assets – current liabilities)
Lindt
2011 = 246.5/(2,516.0 – 682.7) = 0.13
2012 = 244.9/(2,619.9 – 687.0) = 0.13
2013 = 303.0/(3,880.7 – 738.6) = 0.10
Nestle
2011 = 9,804/(114,091 – 35,232) = 0.12
2012 = 10,677/(125,877 – 38,597) = 0.12
2013 = 10,445/(120,442 – 32,917) = 0.12
ROCE refers to the amount of profits attributed to capital employed, excluding liabilities. Nestle had lower ROCE than that of Lindt in 2011 and 2012; hence it did not utilize its capital well to generate profit, especially in 2013 when ROCE was smaller than in the other two years.
4. Stock Market Ratios
Dividend Payout Ratio = Total Dividends/net income
Lindt
2011 = 113.7/246.5 =0.46
2012 = 130.5/244.9 = 0.53
2013 = 147.1/303.0 = 0.49
Nestle
2011 = 6165/9804 = 0.63
2012 = 6,552 /10,677= 0.61
2013 = 6,927/10,445=0.66
This shows amount of earnings paid as dividends. In that case, Nestle pays more earnings as dividends than Lindt.
Earnings Per share = (net income – preferred dividends) ÷ weighted average common shares outstanding
Lindt
2011 = (246,500,000 – 0)/227,387 = 1,084.1
2012 = (244,900,000 – 0)/226,903 = 1,079.3
2013 = (303,000,000 – 0)/226,237 = 1,339.3
Nestle
2011 = (9,487 – 0)/3,196 = 2.97
2012 = (10,228 – 0)/3,186 = 3.21
2013 = (10,015 – 0)/3,191 = 3.14
Earnings per share refer to the earnings or profits attributed to each share of in the company. Each share of Lindt has more earnings than each share of Nestle.
Price Earnings (P/E) Ratio = market value price per share ÷ earnings per share
Lindt
2011 = 31,390/1,084.1 = 28.96
2012 = 34,515/1,079.3 = 31.99
2013 = 48,100/1,339.3 = 35.92
Nestle
2011 = 52.60/2.97 = 17.71
2012 = 67.00/3.21 = 20.87
2013 = 71.34/3.14 = 22.72
This ratio indicates the number of years taken to recover the market price per share. It takes an investor of Nestle 22.72 years as from 2013 to recover his/her market price per share, but it takes an investor 35.92 years as from 2013 to recover his/her market price per share.
Dividend Yield Ratio = cash dividends per share ÷ market value per share
Lindt
2011 = 500/31,390 = 0.02
2012 = 575/34,515 = 0.02
2013 = 650/48,100 = 0.01
Nestle
2011 = 1.87/52.60 = 0.04
2012 = 2.03/67.00 = 0.03
2013 = 2.14/71.34 = 0.03
Dividend Yield Ratio refers to the cash dividend returns received from each unit of investment in the company’s shares. In 2013, a unit investment in Nestle’s shares yielded a cash dividend return of 0.03 but a unit investment in Lindt’s shares yielded 0.01 of cash dividend returns. This indicates that each investment in Nestle yields higher profit proportion than each investment in Lindt.
References list
Harrison, Walter T., and Charles T. Horngren. 2001. Financial accounting. Upper Saddle River, NJ: Prentice Hall.
Read
More
sponsored ads
Save Your Time for More Important Things
Let us write or edit the assignment on your topic
"Financial Ratio Analysis of of Nestle and Lindt"
with a personal 20% discount.
GRAB THE BEST PAPER
