StudentShare

Our website is a unique platform where students can share their papers in a matter of giving an example of the work to be done. If you find papers
matching your topic, you may use them only as an example of work. This is 100% legal. You may not submit downloaded papers as your own, that is cheating. Also you
should remember, that this work was alredy submitted once by a student who originally wrote it.
✕
Free
Stock Market Project - PepsiCo - Case Study Example
Summary
was incorporated in the year 1919 in the state of Delaware. In the year 1986, PepsiCo, Inc. was reincorporated in North Carolina. It is a leading global beverage and food company whose brands are household names that are highly respected. It is listed on the New…
- Subject: Finance & Accounting
- Type: Case Study
- Level: Masters
- Pages: 4 (1000 words)
- Downloads: 0
- Author: sharris
Extract of sample "Stock Market Project - PepsiCo"
Stock Market Project Assignment PepsiCo, Inc. PepsiCo, Inc. was incorporated in the year 1919 in the state of Delaware. In the year 1986, PepsiCo, Inc. was reincorporated in North Carolina. It is a leading global beverage and food company whose brands are household names that are highly respected. It is listed on the New York Stock Exchange (NYSE) where its securities are bought and sold. Its trading symbol is PEP. Its main competitor is the Coca-Cola Company, which was founded by pharmacist Dr. John Pemberton in 1886 in Atlanta, Georgia and incorporated on September 5, 1919 with its principal activity as a beverage company. In the same year, its initial public offering was done on New York Stock Exchange under the symbol CCO but later changed to KO in 1923. Other competitors are as shown in figure 2 below.
PepsiCo, Inc. engages in the sports activities in various ways. It is a sponsor of various sport leagues, venues, and events (MLB, MLS, NHL, Pepsi Center—Home to Denver Nuggets, Colorado Avalanche, Colorado Mammoth, and Colorado Rapids—U.S. Open, Tostitos Fiesta Bowl).
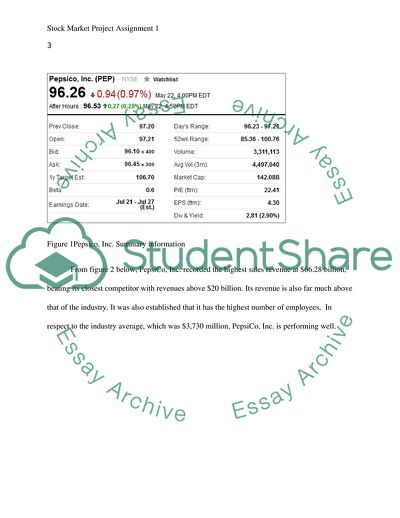
As shown in figure 1 below, the earnings per share for PepsiCo, Inc. is $4.30 while its price-earnings ratio is 22.41. It was also established that the 52-week highs and lows of this company were $100.76 and $85.36 respectively.
Figure 1Pepsico, Inc. Summary information
From figure 2 below, PepsiCo, Inc. recorded the highest sales revenue at $66.28 billion, beating its closest competitor with revenues above $20 billion. Its revenue is also far much above that of the industry. It was also established that it has the highest number of employees. In respect to the industry average, which was $3,730 million, PepsiCo, Inc. is performing well.
Figure 2 Performance of Pepsico, Inc. relative to the peers and the industry
Figure 3 Historical prices (Source: Finance Yahoo, 2015)
Figure 3 above shows the price at which the stock in the Pepsico, Inc. would cost as at May 18, 2015 henceforth.
Foot Locker, Inc.
The other company selected for investment was the Foot Locker, Inc., which operates as an athletic shoes as well as an apparel retailer. Its foundation took place in 1879 and is headquartered in New York. It is listed on the New York Stock Exchange, and its trading symbol is FL. Its main segments are Athletic Stores and Direct-to-Customers. It is through these segments that the Foot Locker, Inc. engages into sport activities where it retails athletic footwear, accessories, apparel and equipment under various formats including Lady Foot Locker, Kids Foot Locker, Foot Locker, Champs Sports, Footaction, Runners Point, and Sidestep.
Figure 4 Foot Locker, Inc. performance relative to its competitors
From figure 4 above, the earnings per share of Foot Locker, Inc. was found to be $3.56, which is above that of the industry but lower than one of its competitors. It was also found that its price-earnings ratio above that of its competitors at 17.83 times but slightly lower than that of the industry. It was also established that its revenues are below those of the industry and Walmart Stores Inc., a competitor.
American Express Company
The third stock was purchased from the American Express Company and whose foundation took place in 1850 and its headquarters are in the New York. Its activities include the provision of charge and credit payment card products as well as travel-related services. American Express Company is engaged in the sport through sponsorships of various sporting events such as the U.S. Open, American Express Community Stadium soccer in Brighton, Falmer, East Sussex, and England.
The figure 5 below shows the price of each stock of American Express Company at various trading dates.
Figure 5 Historical prices (Souce: Finance Yahoo, 2015)
Figure 6 American Express Company’s performance relative to its peers and industry
As shown in figure 6 above, American Express Company has the highest number of employees at 54,000 in comparison with the industry and its competitors. Additionally, its revenue is the highest at $32.09 billion. Further findings established that it had the highest earnings per share of $5.71 while its price-earnings ratio was 14.23 times slightly below the industry average.
Figure 7 Historical prices (Finance Yahoo, 2015)
The figure 7 above shows the price of each stock of American Express Company at various trading dates.
From the various prices that each of the stock from the selected companies to invest with as at 18th may 2015, a total of $9,947.12 will be incurred in constructing a portfolio of three securities. In this respect, a total of 50 shares of Foot Locker, Inc. would be acquired on 18th May, 2015 with each costing $62.78 to sum up to $3,139. On the same context, a total of $2,886.12 would be incurred in purchasing 36 shares of American Express Company since each cost $80.17 on the same date. Finally, 40 shares of PepsiCo, Inc. were purchased at a total cost of $3,922 since each share costs $98.05. From the available cash for investment, there was cash balance of $52.88 that was left uninvested. By this date, the total value of the portfolio was $9,947.12
On 21st May, 2015 all shares of Foot Locker, Inc. were sold for $64 each and realised $3,200. This led to a profit of $61. On the same date, the shares of American Express Company had their price increase to $80.76 each and were all sold for $2,907.36, thereby realising profit of $21.24. However, the shares of PepsiCo, Inc. were held as their value had dropped to $97.20 and their disposal would cause a loss.
Figure 8 Foot Locker, Inc. Source: Yahoo Finance (2015)
Figure 9 American Express Company source: Yahoo Finance (2015)
Figure 10 PepsiCo, Inc. Source: Yahoo Finance (2015)
As indicated in figure 8, 9 and 10, there was no trading in the stocks of Foot Locker, Inc., American Express Company, and PepsiCo, Inc. in 25th May. However, in 28th May 2015, 50 shares of Foot Locker, Inc. were purchased each at $63.13 to amount to $3,156.50. On the same date, 37 shares of American Express Company each at a cost of $80.09 were purchased at a total cost of $2,963.33. This resulted in a portfolio of $10,007.83 and a cash reserve of of $40.41.
.
References
Finance Yahoo. (2015, May 22). American Express Company (AXP)- Historical Prices. Retrieved May 22, 2015, from Finance Yahoo: http://finance.yahoo.com/q/hp?s=AXP+Historical+Prices
Finance Yahoo. (2015, May 22). Foot Locker, Inc. (FL)- Historical Prices. Retrieved May 22, 2015, from Finance Yahoo: http://finance.yahoo.com/q/hp?s=FL+Historical+Prices
Finance Yahoo. (2015, May 22). Pepsico, Inc. (PEP)- Historical Prices. Retrieved May 22, 2015, from Finance Yahoo: http://finance.yahoo.com/q/hp?s=PEP+Historical+Prices
Yahoo Finance. (2015, May). Historical Prices. Retrieved May 31, 2015, from Yahoo Finance: http://finance.yahoo.com/q/hp?s=FL+Historical+Prices
Yahoo Finance. (2015, May). Historical Prices. Retrieved May 31, 2015, from Yahoo Finance: http://finance.yahoo.com/q/hp?s=AXP+Historical+Prices
Yahoo Finance. (2015, May). Historical Prices. Retrieved May 31, 2015, from Yahoo Finance: http://finance.yahoo.com/q/hp?s=PEP+Historical+Prices
Read
More
sponsored ads
Save Your Time for More Important Things
Let us write or edit the case study on your topic
"Stock Market Project - PepsiCo"
with a personal 20% discount.
GRAB THE BEST PAPER
